


| 2002 | 2006 | 2010 | 2014 | 2018 | ||
|---|---|---|---|---|---|---|
| Salario por hora (euros) | 11,95 | 11,14 | 11,39 | 11,17 | 11,3 | |
| Mujer | 0,37 | 0,41 | 0,47 | 0,48 | 0,48 | |
| Edad | ||||||
| <30 años | 0,28 | 0,26 | 0,19 | 0,13 | 0,13 | |
| 30-39 años | 0,32 | 0,33 | 0,34 | 0,33 | 0,26 | |
| 40-49 años | 0,24 | 0,24 | 0,26 | 0,3 | 0,32 | |
| 50-59 años | 0,15 | 0,14 | 0,17 | 0,19 | 0,23 | |
| Más de 60 años | 0,03 | 0,03 | 0,04 | 0,05 | 0,07 | |
| Nivel educativo | ||||||
| Primaria o menos | 0,26 | 0,27 | 0,19 | 0,18 | 0,19 | |
| 1er ciclo Secund. | 0,28 | 0,26 | 0,29 | 0,25 | 0,25 | |
| 2o ciclo Secund. | 0,18 | 0,18 | 0,21 | 0,23 | 0,2 | |
| Univ. | 0,28 | 0,29 | 0,32 | 0,34 | 0,35 | |
| Antigüedad en la empresa | ||||||
| < de 1 año | 0,15 | 0,15 | 0,09 | 0,09 | 0,12 | |
| 1-3 años | 0,36 | 0,39 | 0,32 | 0,26 | 0,28 | |
| 4-7 años | 0,16 | 0,18 | 0,22 | 0,19 | 0,14 | |
| Más de 7 años | 0,33 | 0,29 | 0,37 | 0,45 | 0,45 | |
| Tamaño empresa | ||||||
| <10 trab. | 0 | 0,26 | 0,28 | 0,26 | 0,24 | |
| 10-49 trab. | 0,43 | 0,29 | 0,26 | 0,25 | 0,26 | |
| 50-199 trab. | 0,25 | 0,19 | 0,18 | 0,19 | 0,19 | |
| 200 y más | 0,32 | 0,26 | 0,28 | 0,3 | 0,31 | |
| Tipo de contrato | ||||||
| Indefinido | 0,73 | 0,71 | 0,78 | 0,79 | 0,78 | |
| Tipo de jornada | ||||||
| Completa | 0,89 | 0,83 | 0,78 | 0,75 | 0,75 | |
| No. observaciones | 186,744 | 230,001 | 171,421 | 199,348 | 206,537 | |
| Modelo simple | Modelo extendido | |||||||||||
|---|---|---|---|---|---|---|---|---|---|---|---|---|
| 2002 | 2006 | 2010 | 2014 | 2018 | 2002 | 2006 | 2010 | 2014 | 2018 | |||
| Mujer | -0.218*** | -0.202*** | -0.179*** | -0.171*** | -0.176*** | -0.187*** | -0.170*** | -0.149*** | -0.127*** | -0.133*** | ||
| (0.003) | (0.004) | (0.003) | (0.003) | (0.003) | (0.003) | (0.004) | (0.004) | (0.003) | (0.004) | |||
| Edad | 0.024*** | 0.016*** | 0.009*** | 0.013*** | 0.010*** | 0.018*** | 0.010*** | 0.004*** | 0.009*** | 0.006*** | ||
| (0.001) | (0.001) | (0.001) | (0.001) | (0.001) | (0.001) | (0.001) | (0.001) | (0.001) | (0.001) | |||
| Edad al cuadrado | -0.000*** | -0.000*** | -0.000 | -0.000*** | -0.000*** | -0.000*** | -0.000*** | 0.000 | -0.000 | -0.000 | ||
| (0.000) | (0.000) | (0.000) | (0.000) | (0.000) | (0.000) | (0.000) | (0.000) | (0.000) | (0.000) | |||
| Nivel educativo | ||||||||||||
| 1er ciclo Secundaria | 0.047*** | 0.026*** | 0.039*** | 0.047*** | 0.039*** | 0.010*** | 0.011*** | 0.012*** | 0.012*** | 0.014*** | ||
| (0.004) | (0.004) | (0.005) | (0.005) | (0.005) | (0.004) | (0.004) | (0.004) | (0.004) | (0.005) | |||
| 2o ciclo Secundaria | 0.219*** | 0.175*** | 0.183*** | 0.168*** | 0.154*** | 0.092*** | 0.087*** | 0.091*** | 0.090*** | 0.093*** | ||
| (0.005) | (0.005) | (0.005) | (0.005) | (0.005) | (0.005) | (0.005) | (0.005) | (0.005) | (0.005) | |||
| Universitarios | 0.513*** | 0.447*** | 0.512*** | 0.523*** | 0.504*** | 0.152*** | 0.149*** | 0.155*** | 0.190*** | 0.212*** | ||
| (0.004) | (0.005) | (0.005) | (0.005) | (0.005) | (0.005) | (0.006) | (0.006) | (0.005) | (0.006) | |||
| Antigüedad en la empresa | ||||||||||||
| 1-3 años | 0.062*** | 0.065*** | 0.031*** | 0.042*** | 0.017*** | 0.030*** | 0.037*** | 0.009 | 0.011* | -0.001 | ||
| (0.004) | (0.005) | (0.007) | (0.006) | (0.006) | (0.004) | (0.005) | (0.006) | (0.006) | (0.006) | |||
| 4-7 años | 0.159*** | 0.160*** | 0.092*** | 0.114*** | 0.073*** | 0.089*** | 0.098*** | 0.054*** | 0.046*** | 0.025*** | ||
| (0.005) | (0.006) | (0.007) | (0.006) | (0.006) | (0.005) | (0.006) | (0.007) | (0.006) | (0.007) | |||
| Más de 7 años | 0.352*** | 0.341*** | 0.260*** | 0.245*** | 0.242*** | 0.221*** | 0.215*** | 0.175*** | 0.140*** | 0.147*** | ||
| (0.005) | (0.006) | (0.007) | (0.006) | (0.006) | (0.005) | (0.006) | (0.007) | (0.006) | (0.006) | |||
| Tamaño empresa | ||||||||||||
| 10-49 trabajadores | -0.206*** | 0.094*** | 0.092*** | 0.080*** | 0.074*** | |||||||
| (0.004) | (0.005) | (0.005) | (0.005) | (0.005) | ||||||||
| 50-199 trabajadores | -0.102*** | 0.173*** | 0.171*** | 0.143*** | 0.126*** | |||||||
| (0.004) | (0.005) | (0.004) | (0.005) | (0.005) | ||||||||
| 200 y más trabajadores | 0.276*** | 0.278*** | 0.229*** | 0.222*** | ||||||||
| (0.006) | (0.005) | (0.004) | (0.005) | |||||||||
| Tipo de contrato | ||||||||||||
| Indefinido | 0.064*** | 0.036*** | 0.007* | 0.045*** | 0.035*** | |||||||
| (0.004) | (0.004) | (0.004) | (0.004) | (0.004) | ||||||||
| Tipo de jornada | ||||||||||||
| Completa | -0.042*** | 0.018*** | 0.008* | 0.034*** | 0.025*** | |||||||
| (0.006) | (0.005) | (0.005) | (0.004) | (0.004) | ||||||||
| Dummies de ocupación | SI | SI | SI | SI | ||||||||
| Dummies de sector de actividad | SI | SI | SI | SI | ||||||||
| Constante | 1.441*** | 1.607*** | 1.718*** | 1.578*** | 1.703*** | 2.690*** | 2.531*** | 2.620*** | 2.392*** | 2.477*** | ||
| (0.019) | (0.022) | (0.027) | (0.026) | (0.024) | (0.024) | (0.025) | (0.033) | (0.031) | (0.031) | |||
| R-cuadrado | 0.361 | 0.317 | 0.348 | 0.347 | 0.340 | 0.489 | 0.477 | 0.507 | 0.482 | 0.464 | ||
| No. observaciones | 186,744 | 230,001 | 171,421 | 199,348 | 206,537 | 186,744 | 230,001 | 171,421 | 199,347 | 206,537 | ||
| Brecha salarial de género ajustada (%) | |||||
|---|---|---|---|---|---|
| Año | <30 | 30-39 años | 40-49 años | 50-59 años | Más de 59 años |
| 2002 | 13,24 | 16,83 | 19,75 | 20,42 | 21,8 |
| -0,005 | -0,006 | -0,008 | -0,012 | -0,024 | |
| 2006 | 11,31 | 15,12 | 17,28 | 20,11 | 20,78 |
| -0,007 | -0,007 | -0,008 | -0,011 | -0,03 | |
| 2010 | 9,3 | 12,82 | 14,6 | 16,31 | 20,37 |
| -0,009 | -0,006 | -0,007 | -0,009 | -0,023 | |
| 2014 | 4,69 | 10,75 | 12,62 | 14,97 | 17,21 |
| -0,008 | -0,005 | -0,006 | -0,008 | -0,018 | |
| 2018 | 6,8 | 10,7 | 13,24 | 15,26 | 15,25 |
| -0,009 | -0,006 | -0,005 | -0,01 | -0,014 | |
| % Mujeres | |||||
| 2002 | 42,3 | 38,1 | 36,9 | 29,1 | 25,9 |
| 2006 | 44,8 | 42,2 | 39,9 | 35,9 | 26,2 |
| 2010 | 51,5 | 47,9 | 46,7 | 44,5 | 37,6 |
| 2014 | 50,9 | 49,2 | 47,7 | 45,9 | 41,9 |
| 2018 | 47,7 | 48,8 | 47,8 | 46,1 | 47 |
| Brecha salarial de género ajustada (%) | ||||
|---|---|---|---|---|
| Año | Primaria o menos | 1er ciclo de Educ. Secundaria | 2o ciclo de Educ. Secundaria | Educ. terciaria |
| 2002 | 21,3 | 19,23 | 18,27 | 14,29 |
| -0,006 | -0,007 | -0,008 | -0,006 | |
| 2006 | 18,21 | 15,06 | 17,31 | 15,3 |
| -0,008 | -0,007 | -0,009 | -0,007 | |
| 2010 | 13,76 | 15,03 | 16,96 | 12,54 |
| -0,008 | -0,007 | -0,009 | -0,006 | |
| 2014 | 11,24 | 12,42 | 13,55 | 11,91 |
| -0,007 | -0,006 | -0,007 | -0,006 | |
| 2018 | 13,01 | 13,26 | 14,18 | 12,1 |
| -0,008 | -0,009 | -0,007 | -0,005 | |
| % Mujeres | ||||
| 2002 | 29,9 | 32,7 | 44,8 | 44,2 |
| 2006 | 31,6 | 35,5 | 48 | 49,8 |
| 2010 | 37,8 | 43,3 | 51,9 | 53,3 |
| 2014 | 42,9 | 42,3 | 51,2 | 52,7 |
| 2018 | 40 | 43 | 51,1 | 53,1 |
| Brecha salarial de género ajustada (%) | ||||
|---|---|---|---|---|
| Año | Menos de 1 año | 1-3 años | 4-7 años | Más de 7 años |
| 2002 | 16,08 | 15,99 | 18,93 | 19,37 |
| -0,008 | -0,005 | -0,009 | -0,007 | |
| 2006 | 10,49 | 14,87 | 18,22 | 19,59 |
| -0,009 | -0,006 | -0,009 | -0,007 | |
| 2010 | 9,94 | 11,25 | 15,59 | 17,74 |
| -0,012 | -0,006 | -0,008 | -0,006 | |
| 2014 | 6,99 | 7,8 | 11,17 | 16,35 |
| -0,01 | -0,007 | -0,008 | -0,005 | |
| 2018 | 8,25 | 11,1 | 9,87 | 15,8 |
| -0,01 | -0,008 | -0,009 | -0,005 | |
| % Mujeres | ||||
| 2002 | 40,7 | 39 | 38 | 33,7 |
| 2006 | 40,9 | 41,9 | 43,5 | 37,8 |
| 2010 | 46,1 | 50,6 | 49,9 | 42,9 |
| 2014 | 45,1 | 48,3 | 52,6 | 46,4 |
| 2018 | 44,9 | 44,6 | 47,2 | 50,3 |
| Brecha salarial de género ajustada (%) | |||||
|---|---|---|---|---|---|
| Año | Directores y Gerentes | Técnicos y prof.cientif. | Técnicos y prof. de apoyo | Empleados adminis. | Trabaj. serv. restauración, personales… |
| 2002 | 16,78 | 12,99 | 17,79 | 15,11 | 15,94 |
| -0,027 | -0,008 | -0,009 | -0,009 | -0,01 | |
| 2006 | 24,41 | 13,57 | 14,61 | 14,44 | 14,46 |
| -0,022 | -0,01 | -0,01 | -0,009 | -0,01 | |
| 2010 | 10,82 | 11,66 | 15,22 | 13,91 | 12,43 |
| -0,025 | -0,009 | -0,009 | -0,009 | -0,009 | |
| 2014 | 12,19 | 10,76 | 12,93 | 12,49 | 9,45 |
| -0,022 | -0,008 | -0,008 | -0,007 | -0,007 | |
| 2018 | 13,21 | 10,75 | 12,36 | 10,9 | 12,49 |
| -0,027 | -0,007 | -0,009 | -0,008 | -0,009 | |
| % Mujeres | |||||
| 2002 | 17,9 | 48,1 | 38,7 | 59 | 58,3 |
| 2006 | 23,4 | 56 | 43,9 | 64,6 | 65,7 |
| 2010 | 30,8 | 58 | 41,9 | 65,6 | 66,4 |
| 2014 | 35,2 | 58 | 43,5 | 64,5 | 65 |
| 2018 | 36,2 | 58 | 41,5 | 66,6 | 63,3 |
| Brecha salarial de género ajustada (%) | ||||||||||||
|---|---|---|---|---|---|---|---|---|---|---|---|---|
| Año | Industrias extractivas | Manufacturas | Producción y distribución de energía eléctrica, gas y agua | Construcción | Comercio | Hostelería | Transp. y almacenamiento | Interm. financiera | Actividades Inmobiliarias | Educación | Activ.sanit. | Otras actividades Sociales |
| 2002 | 23,62 | 23,18 | 17,12 | 20,05 | 20,95 | 10,48 | 17,12 | 11,95 | 14,74 | 4,3 | 17,18 | 21,38 |
| -0,042 | -0,004 | -0,023 | -0,019 | -0,011 | -0,008 | -0,016 | -0,013 | -0,01 | -0,009 | -0,011 | -0,012 | |
| 2006 | 18,99 | 22,18 | 22,71 | 15,51 | 14,41 | 10,75 | 16,7 | 14,17 | 15,3 | 2,93 | 21,78 | 18,73 |
| -0,027 | -0,004 | -0,017 | -0,019 | -0,011 | -0,013 | -0,015 | -0,011 | -0,01 | -0,011 | -0,016 | -0,012 | |
| 2010 | 20,1 | 20,94 | 21,92 | 15,93 | 15,01 | 8,97 | 13,93 | 16,35 | 16,02 | 8,57 | 13,48 | 13,91 |
| -0,055 | -0,006 | -0,017 | -0,022 | -0,01 | -0,015 | -0,017 | -0,016 | -0,006 | -0,015 | -0,009 | -0,014 | |
| 2014 | 25,02 | 20,81 | 21,67 | 15,8 | 13,05 | 6,02 | 15,29 | 16,6 | 12,29 | 5,83 | 13,51 | 12,64 |
| -0,042 | -0,005 | -0,015 | -0,021 | -0,009 | -0,011 | -0,013 | -0,015 | -0,005 | -0,014 | -0,01 | -0,012 | |
| 2018 | 13,03 | 20,12 | 19,18 | 6,22 | 13,77 | 6,96 | 16,68 | 17 | 12,58 | 6,04 | 12,06 | 12,36 |
| -0,037 | -0,005 | -0,015 | -0,022 | -0,01 | -0,016 | -0,013 | -0,016 | -0,005 | -0,013 | -0,009 | -0,012 | |
| % Mujeres | ||||||||||||
| 2002 | 7,3 | 25 | 16,2 | 6,6 | 43,1 | 52,1 | 24,4 | 36,1 | 52,1 | 62,6 | 71,5 | 45,3 |
| 2006 | 8,5 | 25,3 | 18,2 | 8,3 | 46,1 | 54,9 | 25,3 | 43,7 | 55,1 | 65,7 | 74,5 | 55,9 |
| 2010 | 8,4 | 25,8 | 20 | 11,4 | 52,5 | 56,8 | 25,8 | 57,7 | 46,3 | 67,3 | 76,8 | 64,1 |
| 2014 | 8,2 | 26,2 | 20,4 | 11,6 | 49,1 | 56,7 | 26,3 | 59,9 | 48,4 | 66,6 | 75,5 | 60,7 |
| 2018 | 10,7 | 26,9 | 21,7 | 11 | 49,4 | 55,6 | 26,8 | 59,9 | 46,2 | 65,3 | 76,5 | 57,7 |
| Brecha salarial de género ajustada (%) | ||||
|---|---|---|---|---|
| Año | 1-9 trab. | 10-49 trab. | 50-199 trab. | 200 y más trab. |
| 2002 | . | 16,25 | 20,51 | 19,69 |
| -0,005 | -0,005 | -0,007 | ||
| 2006 | 13,02 | 16,04 | 17,37 | 19,01 |
| -0,013 | -0,005 | -0,005 | -0,005 | |
| 2010 | 12,44 | 14,9 | 15,84 | 15,25 |
| -0,01 | -0,007 | -0,006 | -0,004 | |
| 2014 | 9,36 | 12,67 | 13,26 | 14,35 |
| -0,009 | -0,007 | -0,006 | -0,004 | |
| 2018 | 11,55 | 12,42 | 13,82 | 13,67 |
| -0,012 | -0,007 | -0,005 | -0,004 | |
| % Mujeres | ||||
| 2002 | 0 | 32,7 | 35,6 | 44,9 |
| 2006 | 40,9 | 34,5 | 39 | 49,2 |
| 2010 | 47,6 | 39,4 | 46,2 | 54,8 |
| 2014 | 48,2 | 42,3 | 46,2 | 53,7 |
| 2018 | 48,1 | 40,7 | 45,5 | 54,1 |
| Brecha salarial de género ajustada (%) | ||
|---|---|---|
| Año | Indefinido | Temporal |
| 2002 | 19,17 | 14,57 |
| -0,004 | -0,006 | |
| 2006 | 18,26 | 11,86 |
| -0,005 | -0,007 | |
| 2010 | 15,59 | 11,72 |
| -0,004 | -0,008 | |
| 2014 | 13,79 | 7,84 |
| -0,004 | -0,007 | |
| 2018 | 14,27 | 9,09 |
| -0,004 | -0,007 | |
| % Mujeres | ||
| 2002 | 37,6 | 36,8 |
| 2006 | 42,1 | 37,9 |
| 2010 | 47,4 | 46,7 |
| 2014 | 47,7 | 49,2 |
| 2018 | 47,6 | 47,6 |
| Brecha salarial de género ajustada (%) | ||
|---|---|---|
| Año | Tiempo completo | Tiempo parcial |
| 2002 | 18,74 | 16,75 |
| -0,003 | -0,016 | |
| 2006 | 17,88 | 11,47 |
| -0,004 | -0,012 | |
| 2010 | 14,94 | 13,76 |
| -0,004 | -0,011 | |
| 2014 | 13,99 | 7,44 |
| -0,003 | -0,008 | |
| 2018 | 13,7 | 10,99 |
| -0,004 | -0,009 | |
| % Mujeres | ||
| 2002 | 32,8 | 74 |
| 2006 | 34,7 | 71,7 |
| 2010 | 40,5 | 71,1 |
| 2014 | 40,8 | 69,3 |
| 2018 | 41,2 | 66,6 |
| Año | p5 | p10 | p25 | p50 | p75 | p90 | p95 |
|---|---|---|---|---|---|---|---|
| 2002 | 13,15 | 13,81 | 15,22 | 18,21 | 21,41 | 24,32 | 25,45 |
| -0,005 | -0,004 | -0,003 | -0,003 | -0,004 | -0,006 | -0,009 | |
| 2006 | 11,4 | 13,14 | 14,16 | 16,85 | 19,47 | 22,13 | 20,96 |
| -0,006 | -0,005 | -0,004 | -0,004 | -0,005 | -0,007 | -0,01 | |
| 2010 | 9,76 | 10,95 | 12,6 | 14,07 | 15,6 | 18,21 | 21,11 |
| -0,005 | -0,005 | -0,004 | -0,004 | -0,005 | -0,006 | -0,008 | |
| 2014 | 9,2 | 9,7 | 10,5 | 11,71 | 13,67 | 16,77 | 18,76 |
| -0,005 | -0,005 | -0,004 | -0,004 | -0,005 | -0,007 | -0,007 | |
| 2018 | 9,18 | 10,18 | 11,21 | 12,67 | 14,23 | 15,37 | 17,86 |
| -0,004 | -0,004 | -0,004 | -0,004 | -0,004 | -0,007 | -0,009 |
Summary
The main objective of the work is to evaluate the gender pay gaps adjusted in Spain, using the Wage Structure survey since 2002 up 2018 . It uses the same methodology as Anghel, Conde-Ruiz and Marra of Artiñano ( 2019 ), including the year 2018 . The main outcome of the working group is that, for the first time in history, we find that the adjusted pay gap increases, 12 , 7 % 2014 to 13 , 3 % 2018 thus, truncándose descending the path we have been noting since the beginning of the twenty-first century. However, we must take these results statistically with caution, since we cannot reject the hypothesis that the coefficients of the year 2014 and the year 2018 the same. Therefore, it would have to wait for the next wave of the ess year 2022 to confirm whether the gap has remained the same, continued to decline or is a change of trend.
Keywords: Wage gap of gender, Labour market, Wage Structure Survey
1 Page.
On the basis that the talent is distributed equally between men and women, there was a growing concern and sensitivity to gender inequality. They are No longer just a question of justice and equity issues, but also of efficiency, in the sense that, if any barriers or obstacles that impede women can develop on equal opportunities with men, we would be missed some of the talent of half the population,World Economic Forum( 2020 ) found that the greater gender equality in a country the greater their per capita income. That is why waste the talent of women is something we cannot afford, given that it is in the coming decades the unstoppable ageing population will cause the population of working age fell significantly.
1 . In particular, will be taken into account a number of characteristics of workers and jobs that are: socio-economic variables (sex, age, level of education and experience) and characteristics of employment and enterprise (company size, type of contract, type of day, occupation and sector of activity). But the task to control by all the features that may potentially affect the wages paid is impossible, even this survey, which provides greater detail of characteristics of wage earners, some that we know that are vital but are not observable as, for example, motivation, leadership, persuasion or attitude to risk.

1 According to the calendar for the publication of statistics of the national institute of statistics, the next wave of the ess year 2022 it would be issued in the year 2024 .
2 . The gender pay gaps without adjusting
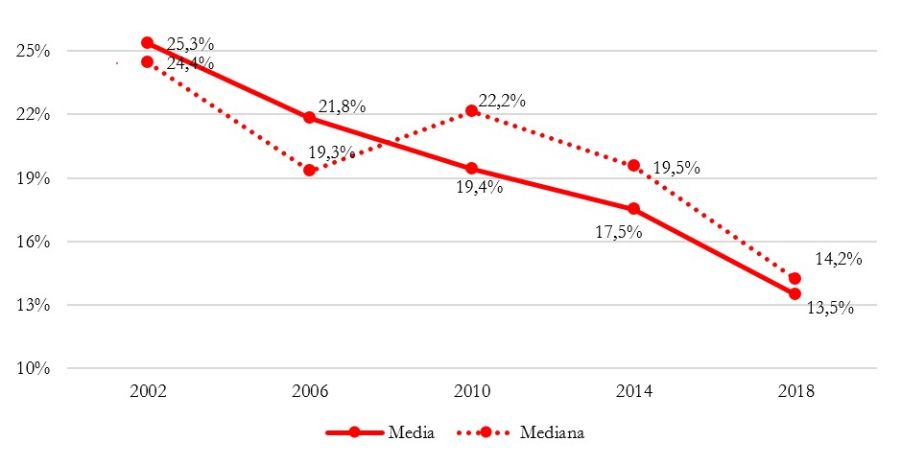
The gender pay gap is defined as the additional percentage men over women, i.e., bringing the women's wages in the denominator. In addition, the measurement of the gender gap is made on the hourly wage, thus rectifying by the increased incidence of time and temporary work among women.
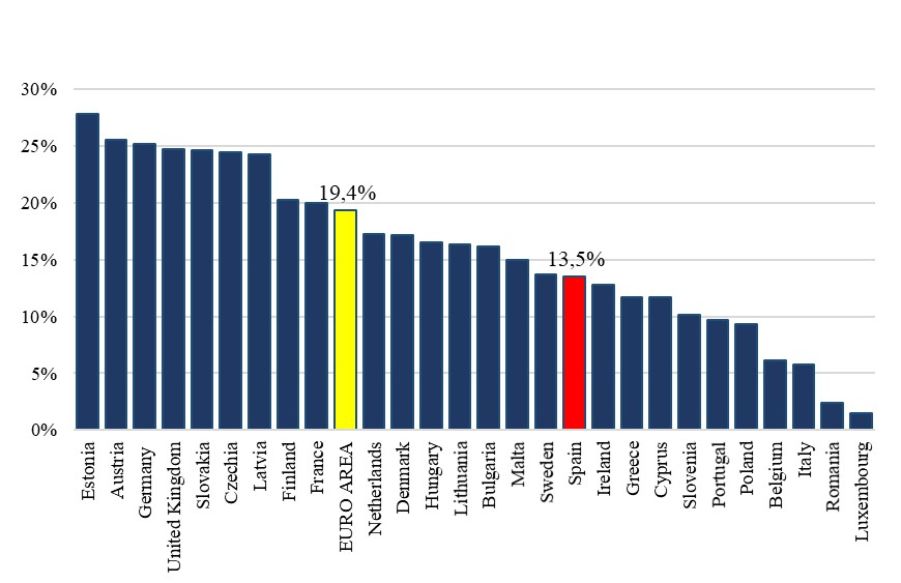
When we analyse the gender gaps without adjusting we find that both the average gap as the medium-sized have been drawn down in the period 2002 - 2018 since around 25 per cent to the 13 , 5 and 14 , 2 % respectively (see graph 1 ).
 Source: Prepared by the authors with data from the ess union (Eurostat), 2018
 Source: Prepared by the authors with data from the ess union (Eurostat), 2018
The effects are pivotal in the estimate of the unadjusted gaps and for this reason, we believe that it is right to analyse the gaps by adjusting by characteristics.
3 . Estimates of the gender pay gap adjusted in Spain: 2002 - 2018
The estimates of the gender gap adjusted, i.e. monitoring by the impact of all relevant observable features account for the salary, are particularly complex and represent the objective of this article. We want to use the same methodology as in Anghel et al. ( 2019 ) using the microdata from the spanish ESS for years 2002 , 2006 , 2010 , 2014 and 2018 . As highlighted in turn Anghel et al. ( 2019 ), one of the most important features of this survey is that it contains microdata that match workers with establishments where they work.
The sample of companies included in the survey has undergone several changes over time In the year. 2002 the ess, does not include companies with fewer than 10 workers. From the year 2006 , are considered all companies, regardless of the number of workers. In the sector of activity, 2002 and 2006 the survey does not include the sector of Public Administration, defence and Social security. From the year 2010 include these sectors also with the aim to harmonise the samples in every year, we will delete to workers in Public Administration, defence and security.
The Ess contains very detailed information on the characteristics of workers (gender, age, educational level, nationality), characteristics of employment (occupation, age, type of contract, type of day, etc.) and company profiles (activity sector, size, etc.). The information on the wages include data on various components of wages (both the basic salary and remuneration or bonus) and is reflected in the month of october the reference year.
| 2002 | 2006 | 2010 | 2014 | 2018 | ||
|---|---|---|---|---|---|---|
| Hourly wage (euros) | 11 , 95 | 11 , 14 | 11 , 39 | 11 , 17 | 11 , 3 | |
| Women | 0 , 37 | 0 , 41 | 0 , 47 | 0 , 48 | 0 , 48 | |
| Age | ||||||
| < |
0 , 28 | 0 , 26 | 0 , 19 | 0 , 13 | 0 , 13 | |
| 30 - 39 years | 0 , 32 | 0 , 33 | 0 , 34 | 0 , 33 | 0 , 26 | |
| 40 - 49 years | 0 , 24 | 0 , 24 | 0 , 26 | 0 , 3 | 0 , 32 | |
| 50 - 59 years | 0 , 15 | 0 , 14 | 0 , 17 | 0 , 19 | 0 , 23 | |
| More than 60 years | 0 , 03 | 0 , 03 | 0 , 04 | 0 , 05 | 0 , 07 | |
| Educational level | ||||||
| Primary or less | 0 , 26 | 0 , 27 | 0 , 19 | 0 , 18 | 0 , 19 | |
| 1 er Secund cycle. | 0 , 28 | 0 , 26 | 0 , 29 | 0 , 25 | 0 , 25 | |
| 2 or Secund cycle. | 0 , 18 | 0 , 18 | 0 , 21 | 0 , 23 | 0 , 2 | |
| Univ. | 0 , 28 | 0 , 29 | 0 , 32 | 0 , 34 | 0 , 35 | |
| In the company | ||||||
| < de |
0 , 15 | 0 , 15 | 0 , 09 | 0 , 09 | 0 , 12 | |
| 1 - 3 years | 0 , 36 | 0 , 39 | 0 , 32 | 0 , 26 | 0 , 28 | |
| 4 - 7 years | 0 , 16 | 0 , 18 | 0 , 22 | 0 , 19 | 0 , 14 | |
| More than 7 years | 0 , 33 | 0 , 29 | 0 , 37 | 0 , 45 | 0 , 45 | |
| Company size | ||||||
| < |
0 | 0 , 26 | 0 , 28 | 0 , 26 | 0 , 24 | |
| 10 - 49 to participate. | 0 , 43 | 0 , 29 | 0 , 26 | 0 , 25 | 0 , 26 | |
| 50 - 199 to participate. | 0 , 25 | 0 , 19 | 0 , 18 | 0 , 19 | 0 , 19 | |
| 200 and more | 0 , 32 | 0 , 26 | 0 , 28 | 0 , 3 | 0 , 31 | |
| Type of contract | ||||||
| Undefined | 0 , 73 | 0 , 71 | 0 , 78 | 0 , 79 | 0 , 78 | |
| Type of day | ||||||
| Complete | 0 , 89 | 0 , 83 | 0 , 78 | 0 , 75 | 0 , 75 | |
| No. observations | 186 , 744 | 230 , 001 | 171 , 421 | 199 , 348 | 206 , 537 | |
As in Anghel et al. ( 2019 ), we use as a measure of wages, gross hourly wage of the month of october. What we estimate based on the methodology used in the National statistics institute as the salary that corresponds to the month of october divided by the number of hours worked in the month of october. The number of hours worked per month is calculated as the number of hours worked per week multiplied by 4 , 35 the number of overtime hours worked during the month of october. Salaries are deflactados and expressed in euros 2015 using the harmonised CPI published by Eurostat.
The wage gap is estimated through an equation Mincer wages, where is controlled by a number of variables relevant to determining the salary of a worker:

where ln (andi ) is the logarithm of the real wages per hour,Womeni it is a variable that takes the notional value 1 the employee is a woman, and 0 if it is man, and xamstel flowedare a number of variables that determine control potentially the wages of an employed person. The ratio of interest is the ratio Β 1 that indicates the percentage difference in wages between a woman and a man. control Variables considered are:
(i)age;
(ii) Within the wide positive behavioral supports the bottling behaviour is a professional with specialized training on issues of conduct. Between its “ know-how ” highlighted key evaluate the resources required by the organization to work properly behaviour, the effectiveness of the consultative process, the direction of a pilot functional analysis and the establishment of an infrastructure to support decision-making based on data.(primary or less, first cycle of secondary education, second cycle of secondary education and university or more);
experience(as in the current company: 1 year 1 - 3 years 4 - 7 years and over 7 years);
(iv)firm size( 1 - 9 workers, 10 - 49 workers, 50 - 199 workers, and 200 and more employees);
(v)type of contract(permanent or temporary basis);
(vi)type of day(in whole or in part);
(vii) occupation(9dummiesbased on National Classification of occupations 1994 and 2011 ); and
(viii) sector of activity(13dummiesbased on National Classification of economic activities 1993 and 2009 ).
3 . 1 . Pay gap adjusted gender total
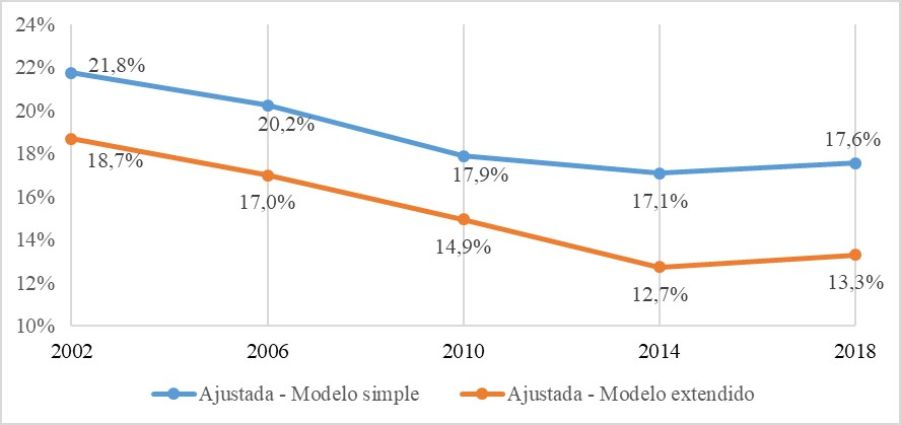
In the table 2 presents the main findings. Shows estimates of the equation of Mincer for all years, using two specifications: (i) one that includes socio-demográficas characteristics of the worker: sex, age, level of education and experience (simple model); and (ii) other which adds to this list of variables characteristics of employment and enterprise: firm size, type of contract, type of day, dummies of occupation and dummies of sector of activity (model extended).
| 2002 | 2006 | 2010 | 2014 | 2018 | 2002 | 2006 | 2010 | 2014 | 2018 | |||
|---|---|---|---|---|---|---|---|---|---|---|---|---|
| Women | - 0 . 171 * * * | - 0 . 176 * * * | - 0 . 187 * * * | - 0 . 170 * * * | - 0 . 149 * * * | - 0 . 127 * * * | ||||||
| ( 0 . 003 ) | ( 0 . 003 ) | ( 0 . 003 ) | ( 0 . 003 ) | ( 0 . 004 ) | ( 0 . 004 ) | ( 0 . 003 ) | ( 0 . 004 ) | |||||
| Age | 0 . 024 * * * | 0 . 016 * * * | 0 . 009 * * * | 0 . 013 * * * | 0 . 010 * * * | 0 . 018 * * * | 0 . 010 * * * | 0 . 004 * * * | 0 . 009 * * * | 0 . 006 * * * | ||
| ( 0 . 001 ) | ( 0 . 001 ) | ( 0 . 001 ) | ( 0 . 001 ) | ( 0 . 001 ) | ( 0 . 001 ) | ( 0 . 001 ) | ( 0 . 001 ) | ( 0 . 001 ) | ( 0 . 001 ) | |||
| Age square | - 0 . 000 * * * | - 0 . 000 * * * | - 0 . 000 | - 0 . 000 * * * | - 0 . 000 * * * | - 0 . 000 * * * | - 0 . 000 * * * | 0 . 000 | - 0 . 000 | - 0 . 000 | ||
| ( 0 . 000 ) | ( 0 . 000 ) | ( 0 . 000 ) | ( 0 . 000 ) | ( 0 . 000 ) | ( 0 . 000 ) | ( 0 . 000 ) | ||||||
| 1 er Secondary cycle | 0 . 026 * * * | 0 . 039 * * * | 0 . 047 * * * | 0 . 039 * * * | 0 . 010 * * * | 0 . 011 * * * | 0 . 012 * * * | 0 . 012 * * * | 0 . 014 * * * | |||
| ( 0 . 004 ) | ( 0 . 004 ) | ( 0 . 005 ) | ( 0 . 005 ) | ( 0 . 005 ) | ( 0 . 004 ) | ( 0 . 004 ) | ( 0 . 004 ) | ( 0 . 004 ) | ( 0 . 005 ) | |||
| 2 or Secondary cycle | 0 . 219 * * * | 0 . 175 * * * | 0 . 183 * * * | 0 . 168 * * * | 0 . 154 * * * | 0 . 092 * * * | 0 . 087 * * * | 0 . 091 * * * | 0 . 090 * * * | 0 . 093 * * * | ||
| ( 0 . 005 ) | ( 0 . 005 ) | ( 0 . 005 ) | ( 0 . 005 ) | ( 0 . 005 ) | ( 0 . 005 ) | ( 0 . 005 ) | ( 0 . 005 ) | ( 0 . 005 ) | ( 0 . 005 ) | |||
| University | 0 . 513 * * * | 0 . 447 * * * | 0 . 512 * * * | 0 . 523 * * * | 0 . 504 * * * | 0 . 152 * * * | 0 . 149 * * * | 0 . 155 * * * | 0 . 190 * * * | 0 . 212 * * * | ||
| ( 0 . 004 ) | ( 0 . 005 ) | ( 0 . 005 ) | ( 0 . 005 ) | ( 0 . 005 ) | ( 0 . 005 ) | ( 0 . 006 ) | ( 0 . 006 ) | ( 0 . 005 ) | ( 0 . 006 ) | |||
| In the company | ||||||||||||
| 1 - 3 years | 0 . 062 * * * | 0 . 065 * * * | 0 . 031 * * * | 0 . 042 * * * | 0 . 017 * * * | 0 . 030 * * * | 0 . 037 * * * | 0 . 009 | 0 . 011 * | - 0 . 001 | ||
| ( 0 . 004 ) | ( 0 . 005 ) | ( 0 . 007 ) | ( 0 . 006 ) | ( 0 . 006 ) | ( 0 . 004 ) | ( 0 . 005 ) | ( 0 . 006 ) | ( 0 . 006 ) | ( 0 . 006 ) | |||
| 4 - 7 years | 0 . 159 * * * | 0 . 160 * * * | 0 . 092 * * * | 0 . 114 * * * | 0 . 073 * * * | 0 . 089 * * * | 0 . 098 * * * | 0 . 054 * * * | 0 . 046 * * * | 0 . 025 * * * | ||
| ( 0 . 005 ) | ( 0 . 006 ) | ( 0 . 007 ) | ( 0 . 006 ) | ( 0 . 006 ) | ( 0 . 005 ) | ( 0 . 006 ) | ( 0 . 007 ) | ( 0 . 006 ) | ( 0 . 007 ) | |||
| More than 7 years | 0 . 352 * * * | 0 . 341 * * * | 0 . 260 * * * | 0 . 245 * * * | 0 . 242 * * * | 0 . 221 * * * | 0 . 215 * * * | 0 . 175 * * * | 0 . 140 * * * | 0 . 147 * * * | ||
| ( 0 . 005 ) | ( 0 . 006 ) | ( 0 . 007 ) | ( 0 . 006 ) | ( 0 . 006 ) | ( 0 . 005 ) | ( 0 . 006 ) | ( 0 . 007 ) | ( 0 . 006 ) | ( 0 . 006 ) | |||
| Company size | ||||||||||||
| 10 - 49 workers | - 0 . 206 * * * | 0 . 094 * * * | 0 . 092 * * * | 0 . 080 * * * | 0 . 074 * * * | |||||||
| ( 0 . 004 ) | ( 0 . 005 ) | ( 0 . 005 ) | ( 0 . 005 ) | ( 0 . 005 ) | ||||||||
| 50 - 199 workers | - 0 . 102 * * * | 0 . 173 * * * | 0 . 171 * * * | 0 . 143 * * * | 0 . 126 * * * | |||||||
| ( 0 . 004 ) | ( 0 . 005 ) | ( 0 . 004 ) | ( 0 . 005 ) | ( 0 . 005 ) | ||||||||
| 200 and more workers | 0 . 276 * * * | 0 . 278 * * * | 0 . 229 * * * | 0 . 222 * * * | ||||||||
| ( 0 . 006 ) | ( 0 . 005 ) | ( 0 . 004 ) | ( 0 . 005 ) | |||||||||
| Type of contract | ||||||||||||
| Undefined | 0 . 064 * * * | 0 . 036 * * * | 0 . 007 * | 0 . 045 * * * | 0 . 035 * * * | |||||||
| ( 0 . 004 ) | ( 0 . 004 ) | ( 0 . 004 ) | ( 0 . 004 ) | ( 0 . 004 ) | ||||||||
| Type of day | ||||||||||||
| Complete | - 0 . 042 * * * | 0 . 018 * * * | 0 . 008 * | 0 . 034 * * * | 0 . 025 * * * | |||||||
| ( 0 . 006 ) | ( 0 . 005 ) | ( 0 . 005 ) | ( 0 . 004 ) | ( 0 . 004 ) | ||||||||
| Dummies of occupation | IF | IF | IF | IF | ||||||||
| Dummies of sector of activity | IF | IF | IF | IF | ||||||||
| Constant | 1 . 441 * * * | 1 . 607 * * * | 1 . 718 * * * | 1 . 578 * * * | 1 . 703 * * * | 2 . 690 * * * | 2 . 531 * * * | 2 . 620 * * * | 2 . 392 * * * | 2 . 477 * * * | ||
| ( 0 . 019 ) | ( 0 . 022 ) | ( 0 . 027 ) | ( 0 . 026 ) | ( 0 . 024 ) | ( 0 . 024 ) | ( 0 . 025 ) | ( 0 . 033 ) | ( 0 . 031 ) | ( 0 . 031 ) | |||
| R-cuadrado | 0 . 361 | 0 . 317 | 0 . 348 | 0 . 347 | 0 . 340 | 0 . 489 | 0 . 477 | 0 . 507 | 0 . 482 | 0 . 464 | ||
| No. observations | 186 , 744 | 230 , 001 | 171 , 421 | 199 , 348 | 206 , 537 | 186 , 744 | 230 , 001 | 171 , 421 | 199 , 347 | 206 , 537 | ||
It has been observed that the salary gap of simple model as the model of extended decline until the year 2014 but, for the first time in the number, the gaps in both models adjusted increased slightly 2018 and it came to a value of 17 , 6 and 13 , 3 % respectively.
As we highlighted in Anghel et al. ( 2019 ), by including characteristics of working (model extended)the wage gap is reduced every year. The explanation probably lay in the simple model does not escape the impact membership: the ratio of dummyin the simple model that could reflect more women with temporary contracts, working part time, in lower-skilled occupations, which are patterns of employment on average pay less. It should be noted that this effect composition by type of employment is very important, as an important part of the wage gap between men and women in the spanish labour market due to the fact that it is noted that women are working on the market segments with lower salaries.
Since the dependant variable of the equation of Mincer notation is the ratio Β 1 is interpreted as follows: the wage differential between a woman and a man is 100 * Β 1 %. In addition, if we want to put this in the same manner as was done in the Section 2 together, the difference between a man and a woman's pay, it would be - 100 * Β 1 % 4 .
As the model spread is the most comprehensive to study the gender gaps adjusted, from now on we are going to focus on this model to analyse that has happened to the evolution of the pay gaps in Spain. In the chart below shows the main outcome of the article: while it is true thatthe gap without adjusting continued to shrink, as we have seen above, the adjusted gap increases in Spain for the first time: from 12 , 7 % 2014 to 13 , 3 % 2018 .
The increase in the adjusted pay gap may indicate that the situation in the labour market is not allowing to take the improvement in the characteristics of women, whether the improvement in the educational level or on the issue.
However, we should interpret this result with some caution, given that if there is a test of the equality of the coefficients of variable “ women ”
Afterwards, we will estimate adjusted gaps between the sexes by characteristics using the same wage equation of Mincer, to identify where or under what features has been an increase in the pay gap.
| Gender pay gap adjusted (%) | |||||
|---|---|---|---|---|---|
| Year | < |
50 - 59 years | |||
| 2002 | 13 , 24 | 16 , 83 | 19 , 75 | 20 , 42 | 21 , 8 |
| Convention on migrant workers (supplementary provisions) | - 0 , 005 | - 0 , 006 | - 0 , 008 | - 0 , 012 | - 0 , 024 |
| 2006 | 11 , 31 | 15 , 12 | 17 , 28 | 20 , 11 | 20 , 78 |
| - 0 , 007 | - 0 , 007 | - 0 , 008 | - 0 , 011 | - 0 , 03 | |
| 2010 | 9 , 3 | 12 , 82 | 14 , 6 | 16 , 31 | 20 , 37 |
| - 0 , 009 | - 0 , 006 | - 0 , 007 | - 0 , 009 | - 0 , 023 | |
| 2014 | 4 , 69 | 10 , 75 | 12 , 62 | 14 , 97 | 17 , 21 |
| - 0 , 008 | - 0 , 005 | - 0 , 006 | - 0 , 008 | - 0 , 018 | |
| 2018 | 6 , 8 | 10 , 7 | 13 , 24 | 15 , 26 | 15 , 25 |
| - 0 , 009 | - 0 , 006 | - 0 , 005 | - 0 , 01 | - 0 , 014 | |
| % Women | |||||
| 2002 | 42 , 3 | 38 , 1 | 36 , 9 | 29 , 1 | 25 , 9 |
| 2006 | 44 , 8 | 42 , 2 | 39 , 9 | 35 , 9 | 26 , 2 |
| 2010 | 51 , 5 | 47 , 9 | 46 , 7 | 44 , 5 | 37 , 6 |
| 2014 | 50 , 9 | 49 , 2 | 47 , 7 | 45 , 9 | 41 , 9 |
| 2018 | 47 , 7 | 48 , 8 | 47 , 8 | 46 , 1 | 47 |
“ child penalty ”) in Spain, is very high, while similar to other countries. Specifically include: (i) one year after having a child's income fall down one mothers 11 , 4 % and this drop continues to expand until 28 per cent in the long term; (ii) the hours worked a 10 per cent in the short term and a 23 % after 10 years; and (iii) precariousness also increases. Unfortunately, this database, to be very precise concerning remuneration, does not provide information on the number of children, which is not possible to estimate the effect that motherhood is on the wage gap.
declining of 17 , 2 % 15 , 2 per cent.
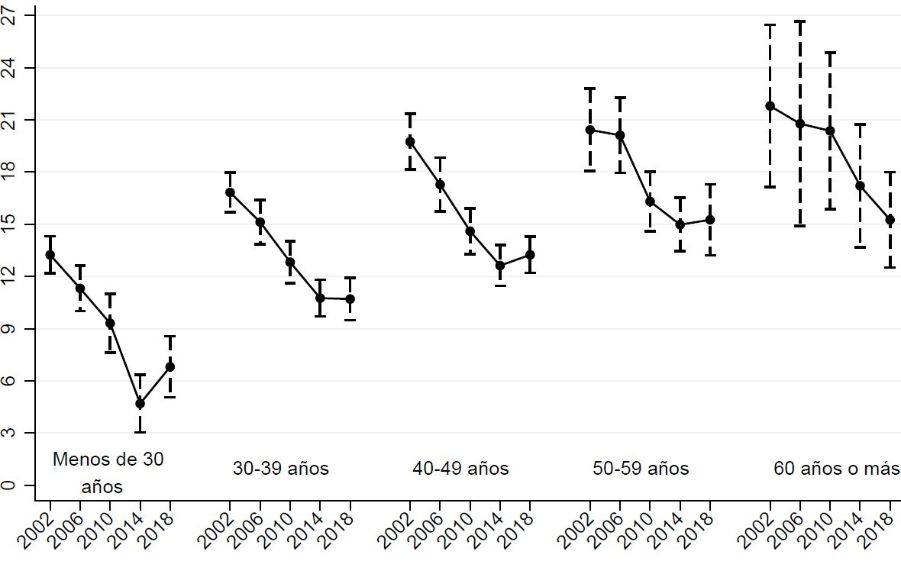 Source: own microdata from the Wage Structure survey 2002 - 2018 (INE). Notes: The adjusted pay gap is considered of a regression of the logarithm of the hourly wage on a dummy of women, age, age square, educational level, age, company size, type of contract, sector and occupation.
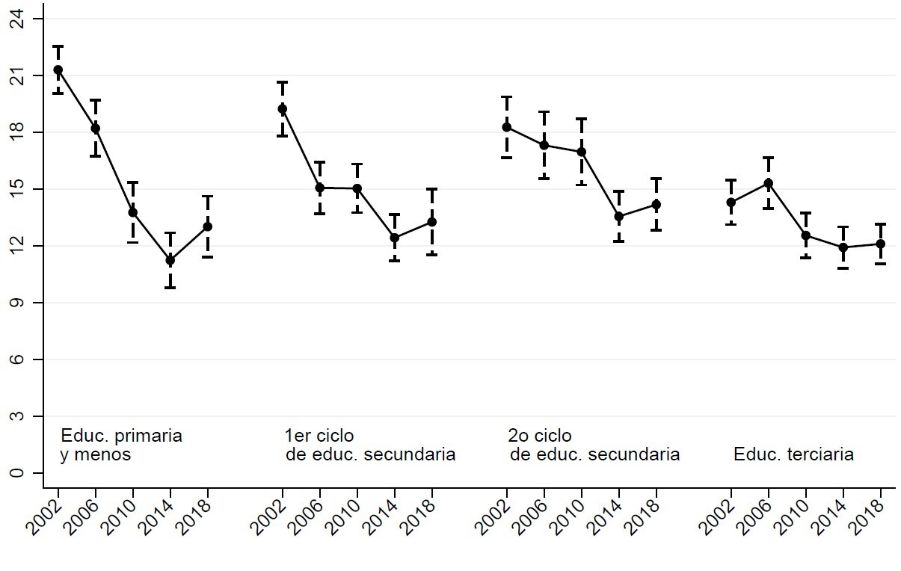
3 . 3 Gender wage gap was set by educational level
This section considers the wage gap between men and women with the same characteristics and labour socio-demográficas but differ on the educational level attained. They are three points. First, as shown in Table 4 women are better represented in the ess according to the qualification: women represent 40 % of workers with primary education (or lower) and 53 % of workers with tertiary qualifications. Second, the results of the adjusted pay gaps show a pay gap in favour of men to all levels of education. Thus, a woman, controlling and for all the characteristics, with primary education in the year, 2018 has an income, a 13 per cent lower than a man with the same characteristics. The gap is 14 , 2 % for workers with secondary education and the 12 , 1 % for group in university studies.
| Gender pay gap adjusted (%) | ||||
|---|---|---|---|---|
| Year | Primary or less | 1 er cycle of Secondary Educ. | 2 or cycle of Secondary Educ. | Tertiary Educ. |
| 2002 | 21 , 3 | 19 , 23 | 18 , 27 | 14 , 29 |
| - 0 , 006 | - 0 , 007 | - 0 , 008 | - 0 , 006 | |
| 2006 | 18 , 21 | 15 , 06 | 17 , 31 | 15 , 3 |
| - 0 , 008 | - 0 , 007 | - 0 , 009 | - 0 , 007 | |
| 2010 | 13 , 76 | 15 , 03 | 16 , 96 | 12 , 54 |
| - 0 , 008 | - 0 , 007 | - 0 , 009 | - 0 , 006 | |
| 2014 | 11 , 24 | 12 , 42 | 13 , 55 | 11 , 91 |
| - 0 , 007 | - 0 , 006 | - 0 , 007 | - 0 , 006 | |
| 2018 | 13 , 01 | 13 , 26 | 14 , 18 | 12 , 1 |
| - 0 , 008 | - 0 , 009 | - 0 , 007 | - 0 , 005 | |
| % Women | ||||
| 2002 | 29 , 9 | 32 , 7 | 44 , 8 | 44 , 2 |
| 2006 | 31 , 6 | 35 , 5 | 48 | 49 , 8 |
| 2010 | 37 , 8 | 43 , 3 | 51 , 9 | 53 , 3 |
| 2014 | 42 , 9 | 42 , 3 | 51 , 2 | 52 , 7 |
| 2018 | 40 | 43 | 51 , 1 | 53 , 1 |
Thirdly, in the Graph 5 you can see how the path of reducing pay gaps fine-tuned by educational level has been truncated in the year 2018 and
 Fuente: Elaboración propia con microdatos de la Encuesta de Estructura Salarial 2002-2018 (INE). Notas: La brecha salarial ajustada se estima de una regresión del logaritmo del salario por hora sobre una dummy de mujer, edad, edad al cuadrado, nivel educativo, antigüedad, tamaño de la empresa, tipo de contrato, sector y ocupación.
3 . 4 Gender wage gap was set by seniority in the company
Another important feature in considering the gender pay gaps is to see what happens depending on the number of years old in the company. On the one hand, it notes that the wage gap between men and women with the same characteristics socio-demográficas and labour increases with age in the company. 2018 a woman with the same characteristics as a man earns 8 , 2 % less than a man if less than a year at the company 15 , 8 % less if more than seven years working in the same company.
| Year | Less than 1 year | 1 - 3 years | 4 - 7 years | |
|---|---|---|---|---|
| 2002 | 16 , 08 | |||
| - 0 , 009 | ||||
| 2006 | 10 , 49 | 18 , 22 | 19 , 59 | |
| - 0 , 009 | ||||
| 2010 | 9 , 94 | 15 , 59 | 17 , 74 | |
| - 0 , 012 | - 0 , 006 | - 0 , 008 | - 0 , 006 | |
| 2014 | 6 , 99 | 7 , 8 | 11 , 17 | 16 , 35 |
| - 0 , 01 | - 0 , 007 | - 0 , 008 | - 0 , 005 | |
| 2018 | 8 , 25 | 11 , 1 | 9 , 87 | 15 , 8 |
| - 0 , 01 | - 0 , 008 | - 0 , 009 | - 0 , 005 | |
| % Women | ||||
| 2002 | 40 , 7 | 39 | 38 | 33 , 7 |
| 2006 | 40 , 9 | 41 , 9 | 43 , 5 | 37 , 8 |
| 2010 | 46 , 1 | 50 , 6 | 49 , 9 | 42 , 9 |
| 2014 | 45 , 1 | 48 , 3 | 52 , 6 | 46 , 4 |
| 2018 | 44 , 6 | 47 , 2 | 50 , 3 | |
Secondly, in the period 2002 - 2014 there had been a significant fall in gaps by age: adjusted in the age of less than 1 year, the reduction of 2002 to 2014 it had been 9 percentage points, the panel with senior 1 - 3 and 4 - 7 years had been 8 pp respectively. However, this downward path of gaps has been interrupted in the year 2018 : the gender gaps of workers with less than 3 years of age have increased from 7 % 8 , 25 % for workers with less than one year old and 7 , 8 % 11 , 1 % for women 2 or 3 years old. However, since 2014 up 2018 workers with 4 years of age have continued to reduce the wage gap with men with the same characteristics (socio-demográficas and labour).
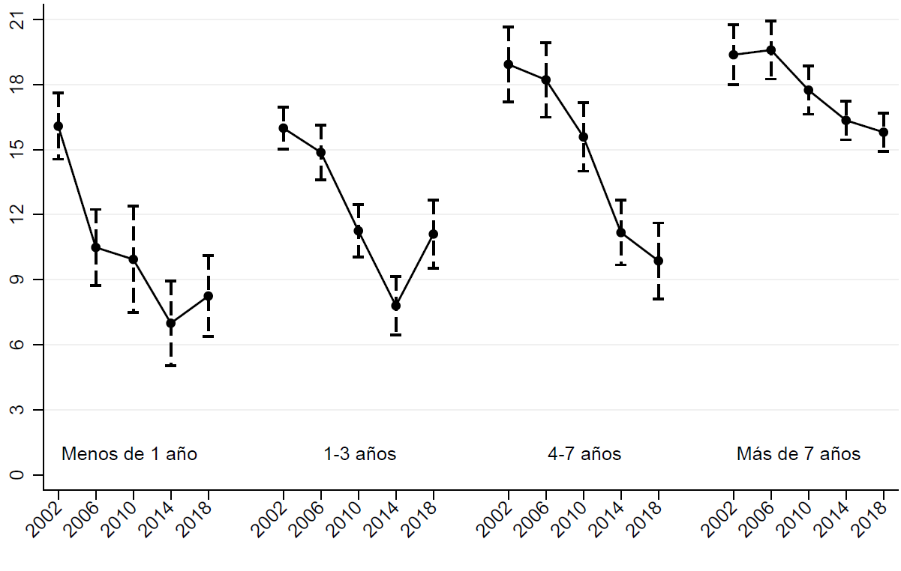 Source: own microdata from the Wage Structure survey 2002 - 2018 (INE). Notes: The adjusted pay gap is considered of a regression of the logarithm of the hourly wage on a dummy of women, age, age square, educational level, age, company size, type of contract, sector and occupation.
3 . 5 . Pay gap as adjusted by gender and occupation by sector of activity
The fine-tuned by wage gaps occupationsin the period under consideration are in the table 5 . There are several features. First, women in the year 2018 they are underrepresented in the following areas: (i) Directors and managers ( 36 , 26 per cent); (ii) technical and vocational Support ( 41 , 5 per cent); (iii) Artisans and Skilled Workers ( 11 , 5 per cent) and (v) equipment operators ( 9 , 8 %). And, women are overrepresented in the following areas: (i) Technical and Scientific Professionals ( 58 per cent); (ii) Administrative Clerks ( 66 per cent); (iii) service, Personal and Restoration; and (iii) non-skilled workers ( 51 , 5 %).
Secondly, the pay gaps are always disadvantageous to women and women are highest in the occupation of craftsmen and Skilled Workers where a woman with the same characteristics wins an observable 24 , 3 % less than a man and the occupation of equipment operators where the gap becomes 18 , 2 %. Precisely these two occupations characterized by very low proportion of women as we have seen it before.
| Directors and managers | Technical and prof.cientif. | Technical support and prof. | Administration employees. | Trabaj. general restoration, personal … | |
|---|---|---|---|---|---|
| 2002 | 16 , 78 | 12 , 99 | 17 , 79 | 15 , 11 | 15 , 94 |
| - 0 , 027 | - 0 , 008 | - 0 , 009 | - 0 , 009 | - 0 , 01 | |
| 2006 | 24 , 41 | 13 , 57 | 14 , 61 | 14 , 44 | 14 , 46 |
| - 0 , 022 | - 0 , 01 | - 0 , 01 | - 0 , 009 | - 0 , 01 | |
| 2010 | 10 , 82 | 11 , 66 | 15 , 22 | 13 , 91 | 12 , 43 |
| - 0 , 025 | - 0 , 009 | - 0 , 009 | - 0 , 009 | ||
| 2014 | 12 , 19 | 10 , 76 | 12 , 93 | 12 , 49 | 9 , 45 |
| - 0 , 022 | - 0 , 008 | - 0 , 008 | - 0 , 007 | - 0 , 007 | |
| 2018 | 13 , 21 | 10 , 75 | 12 , 36 | 10 , 9 | 12 , 49 |
| - 0 , 027 | - 0 , 007 | - 0 , 009 | - 0 , 008 | - 0 , 009 | |
| % Women | |||||
| 2002 | 17 , 9 | 48 , 1 | 38 , 7 | 59 | 58 , 3 |
| 2006 | 23 , 4 | 56 | 43 , 9 | 64 , 6 | 65 , 7 |
| 2010 | 30 , 8 | 58 | 41 , 9 | 65 , 6 | 66 , 4 |
| 2014 | 35 , 2 | 58 | 43 , 5 | 64 , 5 | 65 |
| 2018 | 36 , 2 | 58 | 41 , 5 | 66 , 6 | 63 , 3 |
Bysectors of activity
| Gender pay gap adjusted (%) | ||||||||||||
|---|---|---|---|---|---|---|---|---|---|---|---|---|
| Year | Extractive industries | Manufacturing | Production and distribution of electricity, gas and water | Construction | Trade | Hospitality | Transp. and storage | Financial Interm. | Real Estate activities | Education | Activ.sanit. | Other social activities |
| 2002 | 23 , 62 | 23 , 18 | 17 , 12 | 20 , 05 | 20 , 95 | 10 , 48 | 17 , 12 | 11 , 95 | 14 , 74 | 4 , 3 | 17 , 18 | 21 , 38 |
| - 0 , 042 | - 0 , 004 | - 0 , 023 | - 0 , 019 | - 0 , 011 | - 0 , 008 | - 0 , 016 | - 0 , 013 | - 0 , 01 | - 0 , 009 | - 0 , 011 | - 0 , 012 | |
| 2006 | 18 , 99 | 22 , 18 | 22 , 71 | 15 , 51 | 14 , 41 | 10 , 75 | 16 , 7 | 14 , 17 | 15 , 3 | 2 , 93 | 21 , 78 | 18 , 73 |
| - 0 , 027 | - 0 , 004 | - 0 , 017 | - 0 , 019 | - 0 , 011 | - 0 , 013 | - 0 , 015 | - 0 , 011 | - 0 , 01 | - 0 , 011 | - 0 , 016 | - 0 , 012 | |
| 2010 | 20 , 1 | 20 , 94 | 21 , 92 | 15 , 93 | 15 , 01 | 8 , 97 | 13 , 93 | 16 , 35 | 16 , 02 | 8 , 57 | 13 , 48 | 13 , 91 |
| - 0 , 055 | - 0 , 006 | - 0 , 017 | - 0 , 022 | - 0 , 01 | - 0 , 015 | - 0 , 017 | - 0 , 016 | - 0 , 006 | - 0 , 015 | - 0 , 009 | - 0 , 014 | |
| 2014 | 25 , 02 | 20 , 81 | 21 , 67 | 15 , 8 | 13 , 05 | 6 , 02 | 15 , 29 | . Immigrants introduce greater variety on grounds of racial or ethnic origin, religion, and other factors that may be grounds for discrimination which joined the other general grounds which may lead to lead to discrimination: disability, sexual orientation or age, for example. What can (and often) lead to situations of “ multiple discrimination ” (Valleys, Cea and Domínguez, 2017 ; Cea and valleys, 2021 ) and underlines the need for in this field the approach of the “ Intersectionality ”, as set out for the first time by the African American feminist Crenshaw ( 1989 ) from within the framework of the16 , 6 | 12 , 29 | 5 , 83 | 13 , 51 | 12 , 64 |
| - 0 , 042 | - 0 , 005 | - 0 , 015 | - 0 , 021 | - 0 , 009 | - 0 , 011 | - 0 , 013 | - 0 , 015 | - 0 , 005 | - 0 , 014 | - 0 , 01 | - 0 , 012 | |
| 2018 | 13 , 03 | 20 , 12 | 19 , 18 | 6 , 22 | 13 , 77 | 6 , 96 | 16 , 68 | 17 | 12 , 58 | 6 , 04 | 12 , 06 | 12 , 36 |
| - 0 , 037 | - 0 , 005 | - 0 , 015 | - 0 , 022 | - 0 , 01 | - 0 , 016 | - 0 , 013 | - 0 , 016 | - 0 , 005 | - 0 , 013 | - 0 , 009 | - 0 , 012 | |
| % Women | ||||||||||||
| 2002 | 7 , 3 | 25 | 16 , 2 | 6 , 6 | 43 , 1 | 52 , 1 | 24 , 4 | 36 , 1 | 52 , 1 | 62 , 6 | 71 , 5 | 45 , 3 |
| 2006 | 8 , 5 | 25 , 3 | 18 , 2 | 8 , 3 | 46 , 1 | 54 , 9 | 25 , 3 | 43 , 7 | 55 , 1 | 65 , 7 | 74 , 5 | 55 , 9 |
| 2010 | 8 , 4 | 25 , 8 | 20 | 11 , 4 | 52 , 5 | 56 , 8 | 25 , 8 | 57 , 7 | 46 , 3 | 67 , 3 | 76 , 8 | 64 , 1 |
| 2014 | 8 , 2 | 26 , 2 | 20 , 4 | 11 , 6 | 49 , 1 | 56 , 7 | 26 , 3 | 59 , 9 | 48 , 4 | 75 , 5 | ||
| 2018 | 21 , 7 | 11 | 26 , 8 | 57 , 7 | ||||||||
In the year 2018 in all sectors the gaps are negative for women and the sectors with higher gaps are: manufacturing (an 20 , 1 %), Production and distribution of electricity, gas and water (an 19 , 2 per cent) and Financial Intermediation (an 17 %). The first two sectors are characterized by their low proportion of women.
For the first time in history, the adjusted gender gaps have increased in some sectors such as education, trade and hotels, whereas in areas predominantly occupied by men as manufacturing, construction or Extractive Industries have continued to decline.
3 . 6 . Pay gap adjusted gender by
Thirdly, as shown in figure 7 the wage gap is constantly declining in the year 2018 in companies with more than 200 workers, but it has been broadened in enterprises with less than 200 workers.
| Year | 50 - 199 to participate. | 200 more and to participate. | ||
|---|---|---|---|---|
| 2002 | . | 16 , 25 | ||
| - 0 , 005 | ||||
| 2006 | 16 , 04 | |||
| - 0 , 013 | - 0 , 005 | |||
| 2010 | 12 , 44 | 15 , 25 | ||
| - 0 , 01 | - 0 , 004 | |||
| 2014 | 14 , 35 | |||
| - 0 , 009 | ||||
| 2018 | 11 , 55 | |||
| - 0 , 004 | ||||
| % Women | ||||
| 2002 | 0 | 32 , 7 | An important aspect of the labour market development these years is the active population, which has had a significant growth, more than 900 . 000 persons of which around half a million were foreign.35 , 6 | 44 , 9 |
| 2006 | 40 , 9 | 34 , 5 | 39 | 49 , 2 |
| 2010 | 47 , 6 | 39 , 4 | 46 , 2 | 54 , 8 |
| 2014 | 48 , 2 | 42 , 3 | 46 , 2 | 53 , 7 |
| 2018 | 48 , 1 | 40 , 7 | 45 , 5 | 54 , 1 |
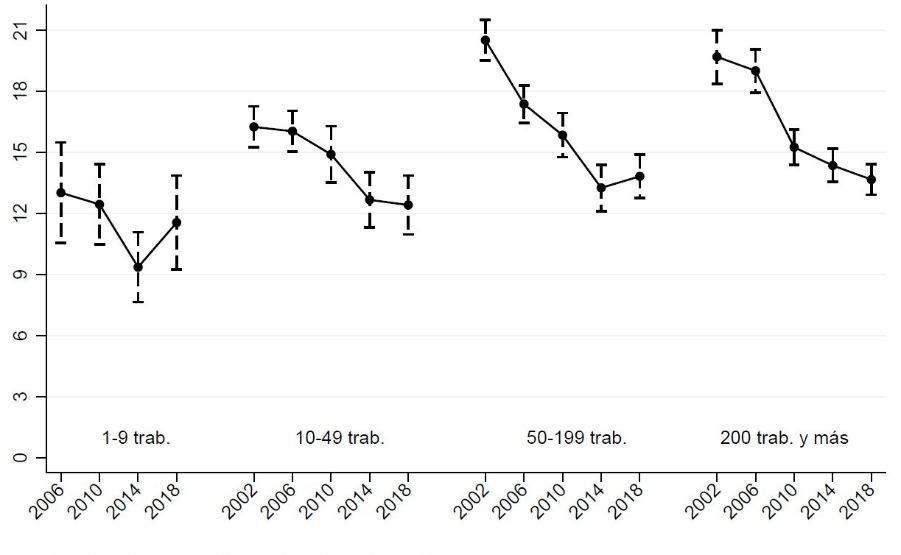 Fuente: Elaboración propia con microdatos de la Encuesta de Estructura Salarial 2002-2018 (INE). Notas: La brecha salarial ajustada se estima de una regresión del logaritmo del salario por hora sobre una dummy de mujer, edad, edad al cuadrado, nivel educativo, antigüedad, tamaño de la empresa, tipo de contrato, sector y ocupación. En 2002 no se encuesta a empresas con menos de 10 trabajadores.
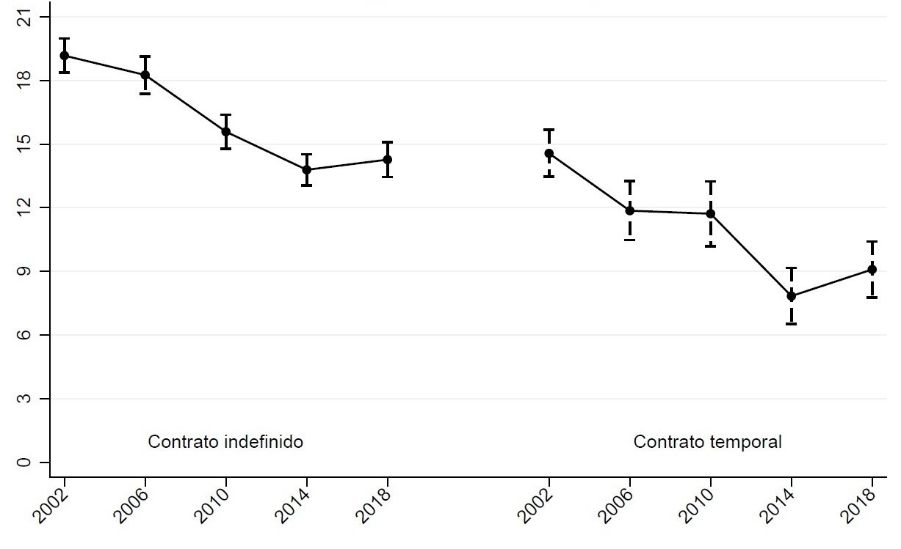
Finally, we look at the wage gap adjusted depending on the type of contract and working hours.
Bytype of contract,
| Gender pay gap adjusted (%) | ||
|---|---|---|
| Year | Undefined | Temporary |
| 2002 | 19 , 17 | 14 , 57 |
| - 0 , 004 | - 0 , 006 | |
| 2006 | 18 , 26 | 11 , 86 |
| - 0 , 005 | - 0 , 007 | |
| 2010 | 15 , 59 | 11 , 72 |
| - 0 , 004 | - 0 , 008 | |
| 2014 | 13 , 79 | 7 , 84 |
| - 0 , 004 | - 0 , 007 | |
| 2018 | 14 , 27 | |
| - 0 , 004 | - 0 , 007 | |
| % Women | ||
| 2002 | 37 , 6 | 36 , 8 |
| 2006 | 42 , 1 | 37 , 9 |
| 2010 | 47 , 4 | 46 , 7 |
| 2014 | 47 , 7 | 49 , 2 |
| 2018 | 47 , 6 | 47 , 6 |
At the time evolution, we see as the gender gaps fine-tuned by contract type were shrinking until the last wave in the year 2018 when they have risen by 3 , 5 per cent in the open-ended contracts and a 16 per cent in temporary contracts.
 Fuente: Elaboración propia con microdatos de la Encuesta de Estructura Salarial 2002-2018 (INE). Notas: La brecha salarial ajustada se estima de una regresión del logaritmo del salario por hora sobre una dummy de mujer, edad, edad al cuadrado, nivel educativo, antigüedad, tamaño de la empresa, tipo de contrato, sector y ocupación.
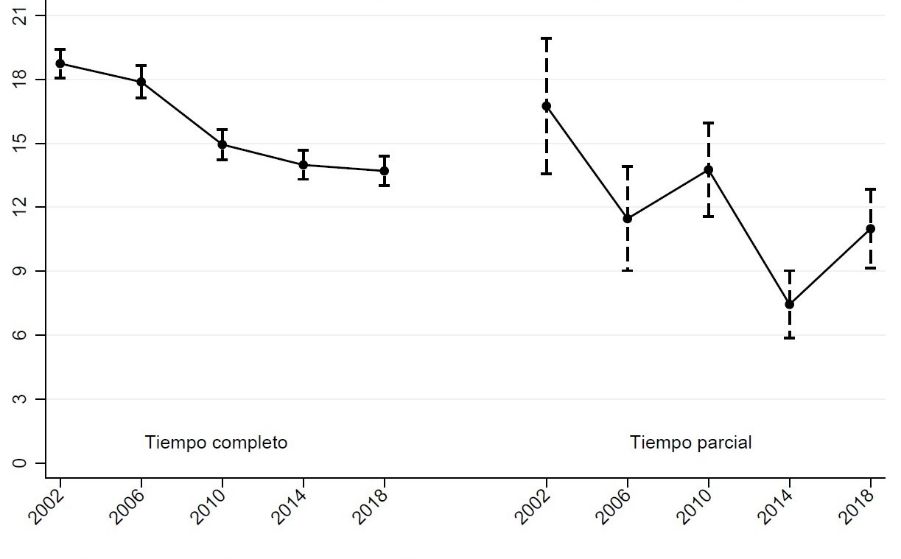
Bytype of day,the salary gap is wider in the case of part-time full-time, a 13 , 7 % 2018 compared to 11 % for workers working part time. The presence of women is much higher in contracts working part time (a 66 , 6 %) that the contracts working full time (a 41 , 2 %).
| Year | ||
|---|---|---|
| 2002 | 16 , 75 | |
| - 0 , 003 | ||
| 2006 | ||
| 2010 | 14 , 94 | 13 , 76 |
| - 0 , 004 | - 0 , 011 | |
| 2014 | 13 , 99 | 7 , 44 |
| - 0 , 003 | - 0 , 008 | |
| 2018 | 13 , 7 | 10 , 99 |
| - 0 , 004 | - 0 , 009 | |
| % Women | ||
| 2002 | 32 , 8 | 74 |
| 2006 | 34 , 7 | 71 , 7 |
| 2010 | 40 , 5 | 71 , 1 |
| 2014 | 40 , 8 | 69 , 3 |
| 2018 | 41 , 2 | 66 , 6 |
At the time evolution record figure 9 we can see how the wage gap has been reduced slightly to work full time (a reduction of - 2 %), but it has been extended for another 48 per cent in part-time contracts.
 Source: own microdata from the Wage Structure survey 2002 - 2018 (INE). Notes: The adjusted pay gap is considered of a regression of the logarithm of the hourly wage on a dummy of women, age, age square, educational level, age, company size, type of contract, sector and occupation.
2 See Anghel et al. ( 2019 ) for details.
3 In Spain the pay gap in basic pay is traditionally lower than the gap in remuneration (Amuedo-Dorantes and the rich, 2006 and the rich et al., 2010 ). According to the ess of 2018 the average annual bonus per employee in spain 2018 about 4 . 000 euros for men and about 3 . 300 euros for women.
4 It is worth noting that this interpretation of the ratio of dummy of women is an approximation is usually done in the empirical analyses when the dependant variable logarithm is in.
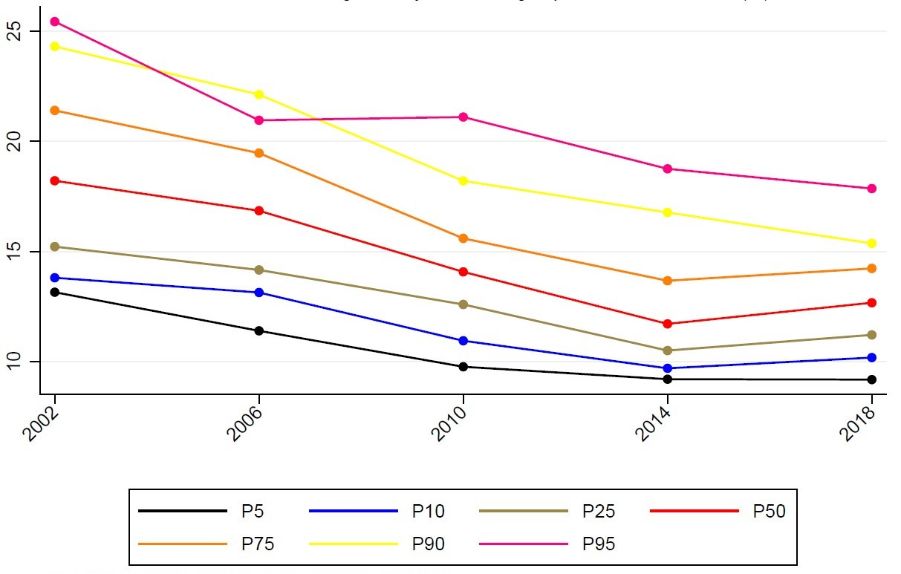
4 . Gender wage gaps adjusted over the distribution of wages
As we did in Anghel et al. ( 2019 ) in this section we complement the analysis, considering the adjusted pay gaps over the distribution of wages. The adjusted pay gaps are estimated using the cuantílicas regressions. ( 5 .
| p 25 | |||||||
|---|---|---|---|---|---|---|---|
| 2002 | 13 , 15 | 15 , 22 | |||||
| - 0 , 004 | - 0 , 003 | - 0 , 004 | - 0 , 009 | ||||
| 2006 | 11 , 4 | 13 , 14 | 14 , 16 | 16 , 85 | 19 , 47 | 22 , 13 | 20 , 96 |
| - 0 , 006 | - 0 , 005 | - 0 , 004 | - 0 , 004 | - 0 , 005 | - 0 , 007 | - 0 , 01 | |
| 2010 | 9 , 76 | 10 , 95 | 12 , 6 | 14 , 07 | 15 , 6 | 18 , 21 | 21 , 11 |
| - 0 , 005 | - 0 , 005 | - 0 , 004 | - 0 , 004 | - 0 , 005 | - 0 , 006 | - 0 , 008 | |
| 2014 | 9 , 2 | 9 , 7 | 10 , 5 | 11 , 71 | 13 , 67 | 16 , 77 | 18 , 76 |
| - 0 , 005 | - 0 , 005 | - 0 , 004 | - 0 , 004 | - 0 , 005 | - 0 , 007 | - 0 , 007 | |
| 2018 | 9 , 18 | 10 , 18 | 11 , 21 | 12 , 67 | 14 , 23 | 15 , 37 | 17 , 86 |
| - 0 , 004 | - 0 , 004 | - 0 , 004 | - 0 , 004 | - 0 , 004 | - 0 , 007 | - 0 , 009 |
 Source: own microdata from the Wage Structure survey 2002 - 2018 (INE). Notes: The adjusted pay gap is considered of a regression of the logarithm of the hourly wage on a dummy of women, age, age square, educational level, age, company size, type of contract,
5 Regressions. cuantílicas estimated the impact of variable control over specific percentile dependent variable, as well as the estimated regular squares measures the impact of the environment variable control over the average of the dependant variable. Therefore, allow the relationship between the dependant variable variables and differs control over the distribution of wages.
5. Conclusiones
In this article we have updated the results of Anghel, Conde-Ruiz and Marra of Artiñano ( 2019 ) incorporating the latest wave of the ess for the year 2018 . We find that for the first time in the historical series gender gaps fine-tuned by observable characteristics are increasing. In particular, the adjusted pay gap increases from 12 , 7 % 2014 to 13 , 3 % 2018 .
In any case, the results achieved in the article show that wage terms women are in a worse situation than men with similar characteristics observable. This is a loss of talent and potential growth that no economy can afford, let alone in a context of population ageing in which we find ourselves.
Referencias
Amuedo-Dorantes, C. and S. The Rich ( 2006 ), “The Role of Segregation and Pay Structure on the Gender Wage Gap: Evidence from Matched Employer-Employee Data for Spain”, The B.E. Journal of Economic Analysis & Policy, 5 issue 1 , p. 1 - 34
Anghel, B., Conde-Ruiz J. and I. Marra of Artíñano ( 2019 ), "Brechas Salariales de Género en España," Hacienda Pública Española / Review of Public Economics, IEF, vol. 229 ( 2 ), p. 87 - 119 .
Conde-Ruiz, J. and I. Marra of Artíñano ( 2016 ), "Gender Gaps in the Spanish Labor Market," Studies on the Spanish Economy eee 2016 - 32 , FEDEA.
Conde-Ruiz, J., García, M and M. Yáñez ( 2019 ), "Does a “soft” board gender quotas policy work?," Applied Economic Analysis, Emerald Group Publishing Limited, vol. 28 ( 82 ), pages 46 - 68 , November.
The rich, S., Dolado, J. and Llorens, V. ( 2008 ), “Ceilings or Floors? Gender Wage Gaps by Education in Spain”, Journal of Population Economics, Vol. 21 ( 3 ), 751 - 776
The rich, S., Dolado, J. and Vegas-sánchez, R. ( 2010 ), “Performance Pay and the Gender Wage Gap: Evidence from Spain”, CEPR Discussion Paper Series No. 7936 .
Fifth, A, Hospido, L and C. Sanz ( 2021 ), "The child penalty: evidence from Spain", SERIEs: Journal of the Spanish Economic Association, vol. 12 ( 4 ), pages 585 - 606 .
World Economic Forum, Global Gender Gap Report 2020 available at: http://www 3 .weforum.org/docs/WEF _ GGGR _ 2020 .pdf


.jpg)


